Home Page


Expanding and exploring the frontiers of science and mathematics.
Get started by exploring our Areas of Study
We prepare the next generation of problem solvers to discover and innovate solutions for the future.
The College of Science promotes novel ways of thinking and implementation in a rapidly changing world.
We provide our scholars with hands-on experience, cross/multi-disciplinary research, and faculty and staff mentors who not only educate but inspire our scholars.

Next Steps to Enroll
From deposit to housing, view the first five steps for accepted first-year students.
Visit Us on Campus
Tours and information sessions are offered six days a week or you can explore other ways to experience RIT.

Faces of RIT
-
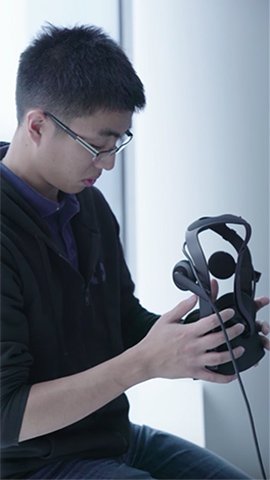
![Kevin Kha using a VR headset.]()
Enhancing Reality
Kevin KhaImaging ScienceKha interned with Oculus testing their next generation of VR cameras, which have the potential to aid law enforcement and impact learning in schools. The internship turned into a full-time job, and Kha plans to work on enhancing the VR experience.
-
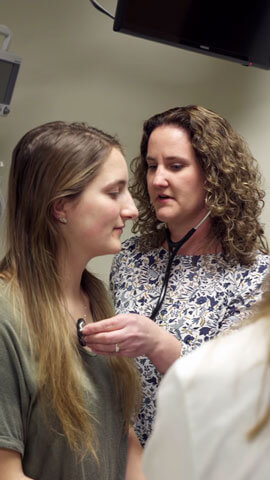
![Jennifer Wheeler, M.D.]()
Giving Back
Jennifer Wheeler, M.D. BS ’01BiotechnologyFamily MedicineAfter 9/11, Wheeler enlisted in the US Army and served as a doctor in Afghanistan. Now, she practices family medicine and serves as a preceptor to RIT students who are embarking on their own careers in medicine.
-
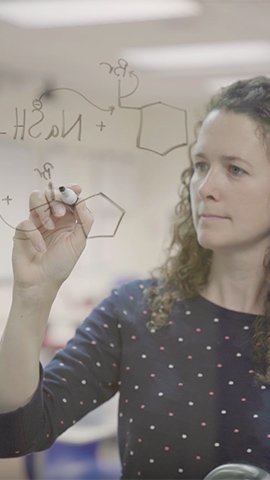
![Professor Tina Goudreau Collison writing a chemistry formula.]()
Expanding ASL
Tina Goudreau CollisonProfessor of ChemistryA complicated vocabulary and a lack of dedicated signs in American Sign Language makes Organic Chemistry a challenge for deaf and hard of hearing students. Collision worked with interpreters to develop new ASL signs, leading to profound learning improvements for her students.
-
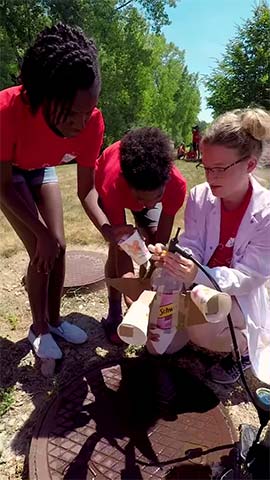
![Devon Christman conducting a science experiment with some kids.]()
Connecting Kids to Science
Devon M ChristmanPhysicsOver the summer, Christman taught a workshop called “Experiments in Science” to a group of children from RIT’s Kids on Campus program. By helping to change their perspectives on who and what a scientist is, Christman is shaping the minds of tomorrow’s scientists.
-
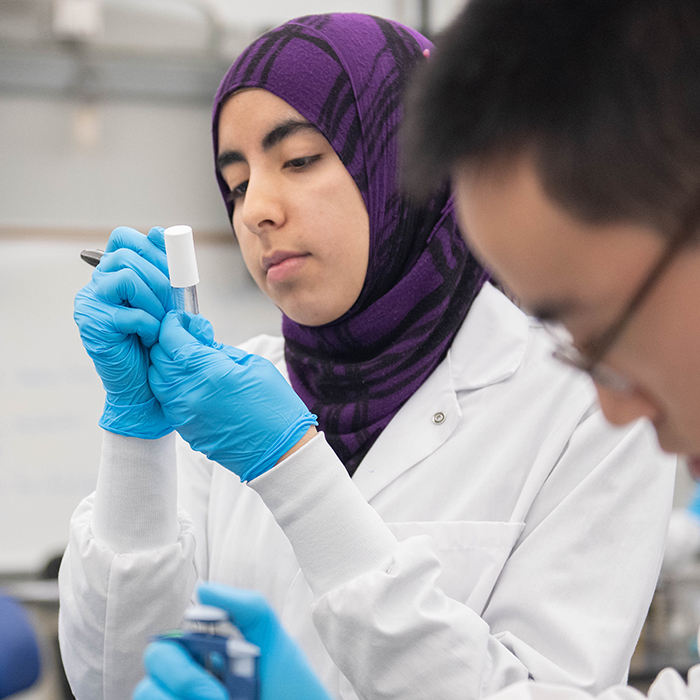
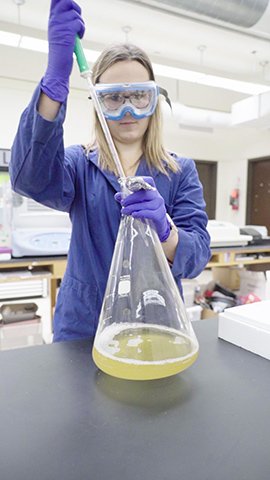
![Nicole Pannullo working in a chemistry lab.]()
Medicine's Future
Nicole PannulloBiochemistryBy working on a faculty-guided research project, Pannullo has gained hands-on research experience to pursue a future in regenerative medicine. It’s one way Pannullo is putting experiential learning to work.
Latest News
-
April 17, 2024
![Robert Rothman with former student Jay Kucharek]()
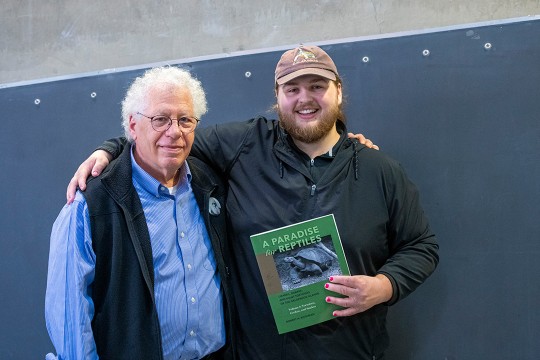
‘A Paradise for Reptiles’ by Robert Rothman
RIT Press book launch for "A Paradise for Reptiles" puts RIT author, professor emeritus Robert Rothman, in the spotlight.
-
April 16, 2024
![Three students stand in an open area of a university.]()
RIT’s Expressive Communication Center students explore ableism in communication-focused settings
RIT's Expressive Communication Center delves into the challenges of ableism in communication education, presenting their findings at a national conference in Arizona. ECC students aim to foster dialogue on accessibility and inclusive communication practices, advocating for more inclusive assessment methods in higher education.
-
April 15, 2024
![Aiden Miller is shown posing in front of their research which is hanging on a building window.]()
Biochemistry student receives Barry M. Goldwater Scholarship
RIT third-year biochemistry student Aidan Miller has been awarded a Barry Goldwater Scholarship, the most prestigious undergraduate research scholarship in the United States, given to students pursuing a career in the natural sciences, mathematics, or engineering. -
April 15, 2024
![Stonehenge II, a concrete sculpture in Ingram TX is shown.]()
To each their own: In Texas town, reasons vary for watching eclipse
France 24 talks to Grover Swartzlander, professor in the Chester F. Carlson Center for Imaging Science, about viewing the recent eclipse from Stonehenge II in Texas.