Endowment Earnings
Click here for additional information about giving to the University. The University’s endowment includes both donor-restricted endowment funds and funds designated by the Board of Trustees to function as endowments. The University currently accounts for endowment activity in two investment pools, Pool I and Pool II. Pool I is comprised of contributions, both donor-restricted and board-designated, made to the University for a variety of purposes, as well as contributions transferred from Pool II. Pool II is comprised of contributions, both donor-restricted and board-designated, made to the National Technical Institute for the Deaf. Each pool has a separate investment and spending policy.
The Board of Trustees determines the appropriate amount to withdraw from endowment and similar funds on an annual basis to provide support for operations with prudent concern for the long-term growth in the underlying assets as well as the specific factors detailed in the New York Prudent Management of Institutional Funds Act (NYPMIFA) and the Federal Education of the Deaf Act. The Endowment Committee is charged with the responsibility for directing the investment of the endowment assets according to the Investment Policy.
Purpose
The financial objective of the endowment portfolio is to provide a sustainable level of income distribution in support of the University’s mission while preserving the purchasing power of the remaining invested assets. To satisfy its long-term rate-of-return objectives, the University relies on a total return strategy in which investment returns are achieved through both capital appreciation (realized and unrealized) and current yield (interest and dividends). The University targets a diversified asset allocation that places a greater emphasis on equity-based and alternative investments to achieve its long-term objectives within prudent risk constraints.
Spending Policy
Pool I – The University has a policy of appropriating for distribution each year 5% of its endowment fund’s average fair value over the prior 20 quarters through March of the preceding fiscal year in which the distribution is planned. The total spending distribution should be at least equal to 3.50% but not greater than 5.25% of the beginning of year portfolio market value. The distribution excludes those funds with deficiencies due to unfavorable market fluctuations.
Accordingly, over the long term, the University expects the current spending policy to allow its endowment to grow at a rate exceeding expected inflation, consistent with the University’s objective to maintain the purchasing power of the endowment assets held in perpetuity or for a specified term as well as to provide additional real growth through new gifts and investment return.
Pool II – Federal guidelines authorize a spending distribution from Pool II of not more than 50% of current year’s investment income (interest and dividends only).
Asset Classes
The University targets a diversified asset allocation that places a greater emphasis on equity-based and alternative investments to achieve its long-term objectives.
- Marketable Securities
- U.S.Equities
- International Equities
- Global Fixed Income
- Alternative Investments
- Private Equity
- Hedge/ Absolute Return Strategies
- Real Assets (inflation-hedged assets)
Asset Allocation Policy
Policy last updated June 30, 2023
Policy Allocation (Strategic View)
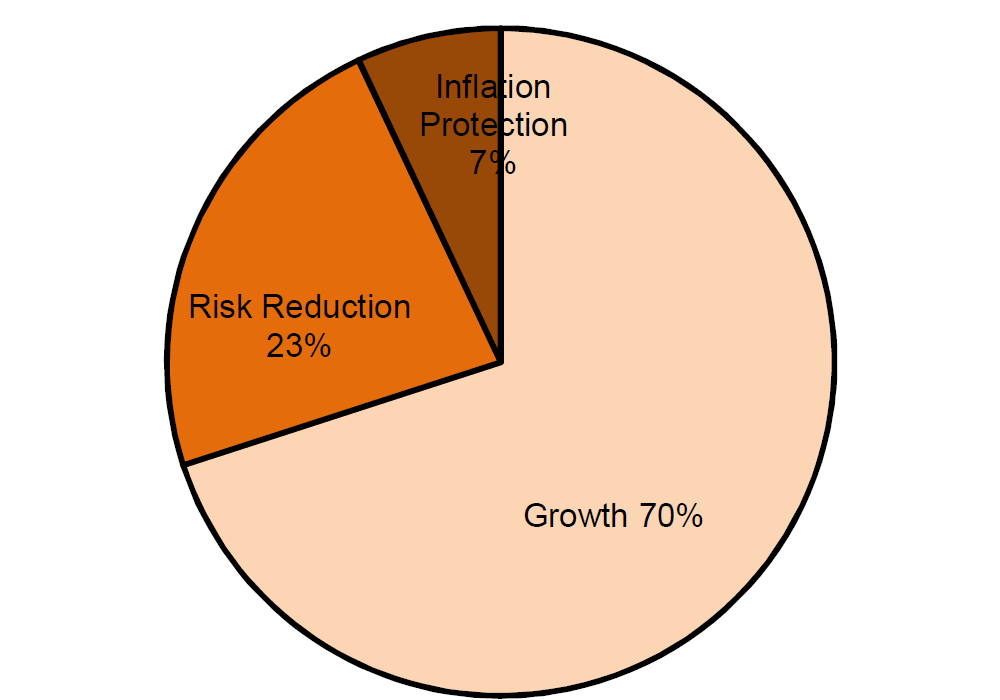
| Policy Allocation (Strategic) | Target |
|---|---|
| Growth | 70% |
| US Equities | 19% |
| International Equities | 18% |
| Long-Biased Hedge Funds | 5% |
| Private Equity | 28% |
| Private Debt | 0% |
| Risk Reduction | 23% |
| Hedge Funds | 18% |
| US Fixed Income | 5% |
| Inflation Protection | 7% |
| Real Assets | 7% |
Policy Allocation (Traditional View)
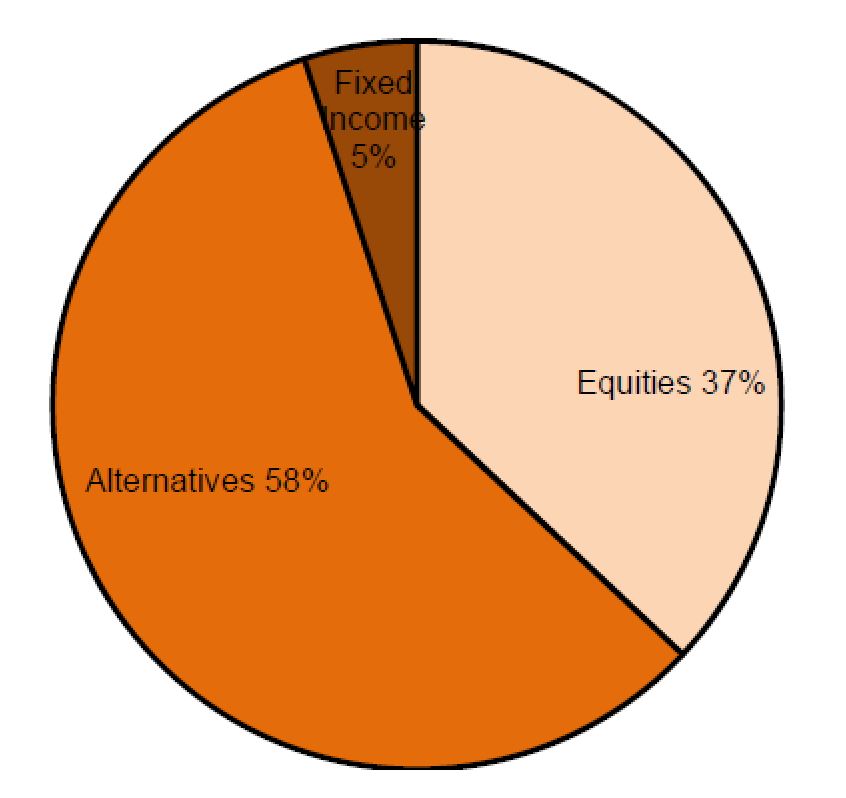
| Policy Allocation (Traditional) | Target |
|---|---|
| Equities | 37% |
| US Equities | 19% |
| International Equities | 18% |
| Alternatives | 58% |
| Hedge Funds | 23% |
| Real Assets | 7% |
| Private Equity | 28% |
| Fixed Income | 5% |
| US Fixed Income | 5% |
Pool I Asset Allocation
|
Asset Class |
June 30, 2023 Actual |
June 30, 2023 Target |
|---|---|---|
| US Equities | 16.40% | 19.00% |
| International Equities | 13.50% | 18.00% |
| Fixed Income | 1.80% | 5.00% |
| Total Marketable Securities | 31.70% | 42.00% |
| Private Equity | 35.00% | 28.00% |
| Hedge/Absolute Return Strategy | 24.10% | 18.00% |
| Real Assets (inflation-hedged assets) | 9.20% | 7.00% |
| Total Alternative Investments | 68.30% | 53.00% |
| Cash | 0.00% | 0.00% |
| Total Assets | 100.0% | 100.0% |
Investment Performance
Endowment Historical Performance
|
Fiscal Year End |
Market Value ($ Millions) |
1-year Return |
|---|---|---|
| 6/30/2023 | 1,282.5 | 5.4% |
| 6/30/2022 | 1,256.8 | 3.7% |
| 6/30/2021 | 1,302.9 | 39.0% |
| 6/30/2020 | 954.0 | 0.2% |
| 6/30/2019 | 957.2 | 6.0% |
| 6/30/2018 | 938.1 | 10.0% |
| 6/30/2017 | 847.2 | 13.4% |
| 6/30/2016 | 750.9 | 0.1% |
| 6/30/2015 | 761.9 | 3.0% |
| 6/30/2014 | 753.9 | 15.1% |
| 6/30/2013 | 669.1 | 9.3% |
| 6/30/2012 | 628.1 | 2.3% |