Multimodal Assessment of Environmental Factors Driving a Phytoplankton Bloom in Lake Victoria
Principal Investigator(s)
Anthony Vodacek
Research Team Members
Therese Georgia (Undergraduate Student)
Project Description
As the largest lake in Africa and the second-largest in the world by surface area, Lake Victoria is a critical resource, providing food, employment, and clean drinking water to millions of people. Any disruption to the lake's typical functioning can have widespread impacts on the region's livelihoods. Previous observations have shown that the lake can experience a unique type of cyclonic upwelling that critically disrupts stratification, leading to lower temperature, nutrient-rich water, producing a phytoplankton bloom, yet the driving mechanism remains poorly understood. The cause is thought to be wind stress from severe storms, but this has not been confirmed.
This study addresses this gap by analyzing remote sensing data (e.g., surface temperature and chlorophyll a) and meteorological data (e.g., rain accumulation and wind vectors) to establish a direct link between specific regional weather events and the observed water circulation/cyclonic upwelling patterns from two known upwelling events in March 1969 and July 2019. The meteorological data was obtained from the ERA5-Land reanalysis dataset (available from 1950 to present). By analyzing the weather patterns, before and after the observation of upwelling we can evaluate whether mesoscale circulation, leading to upwelling, was present. Hourly wind vector time series (Fig. 1) and vorticity time series (Fig. 2) for March 1969 and July 2019 have been created to visualize potential trends in the wind patterns between the two months. The vorticity is an important measurement for understanding circulation behavior and upwelling events in Lake Victoria, as it measures the tendency of a flow field to rotate and can indicate strong rotation trends in the wind that potentially cause upwelling. Our objective is to identify conditions leading to the upwelling and then searching the ERA5-Land record for similar conditions and identifying whether these are common or rare events. Preliminary results will be presented at IGARSS 2026.
Figures and Images
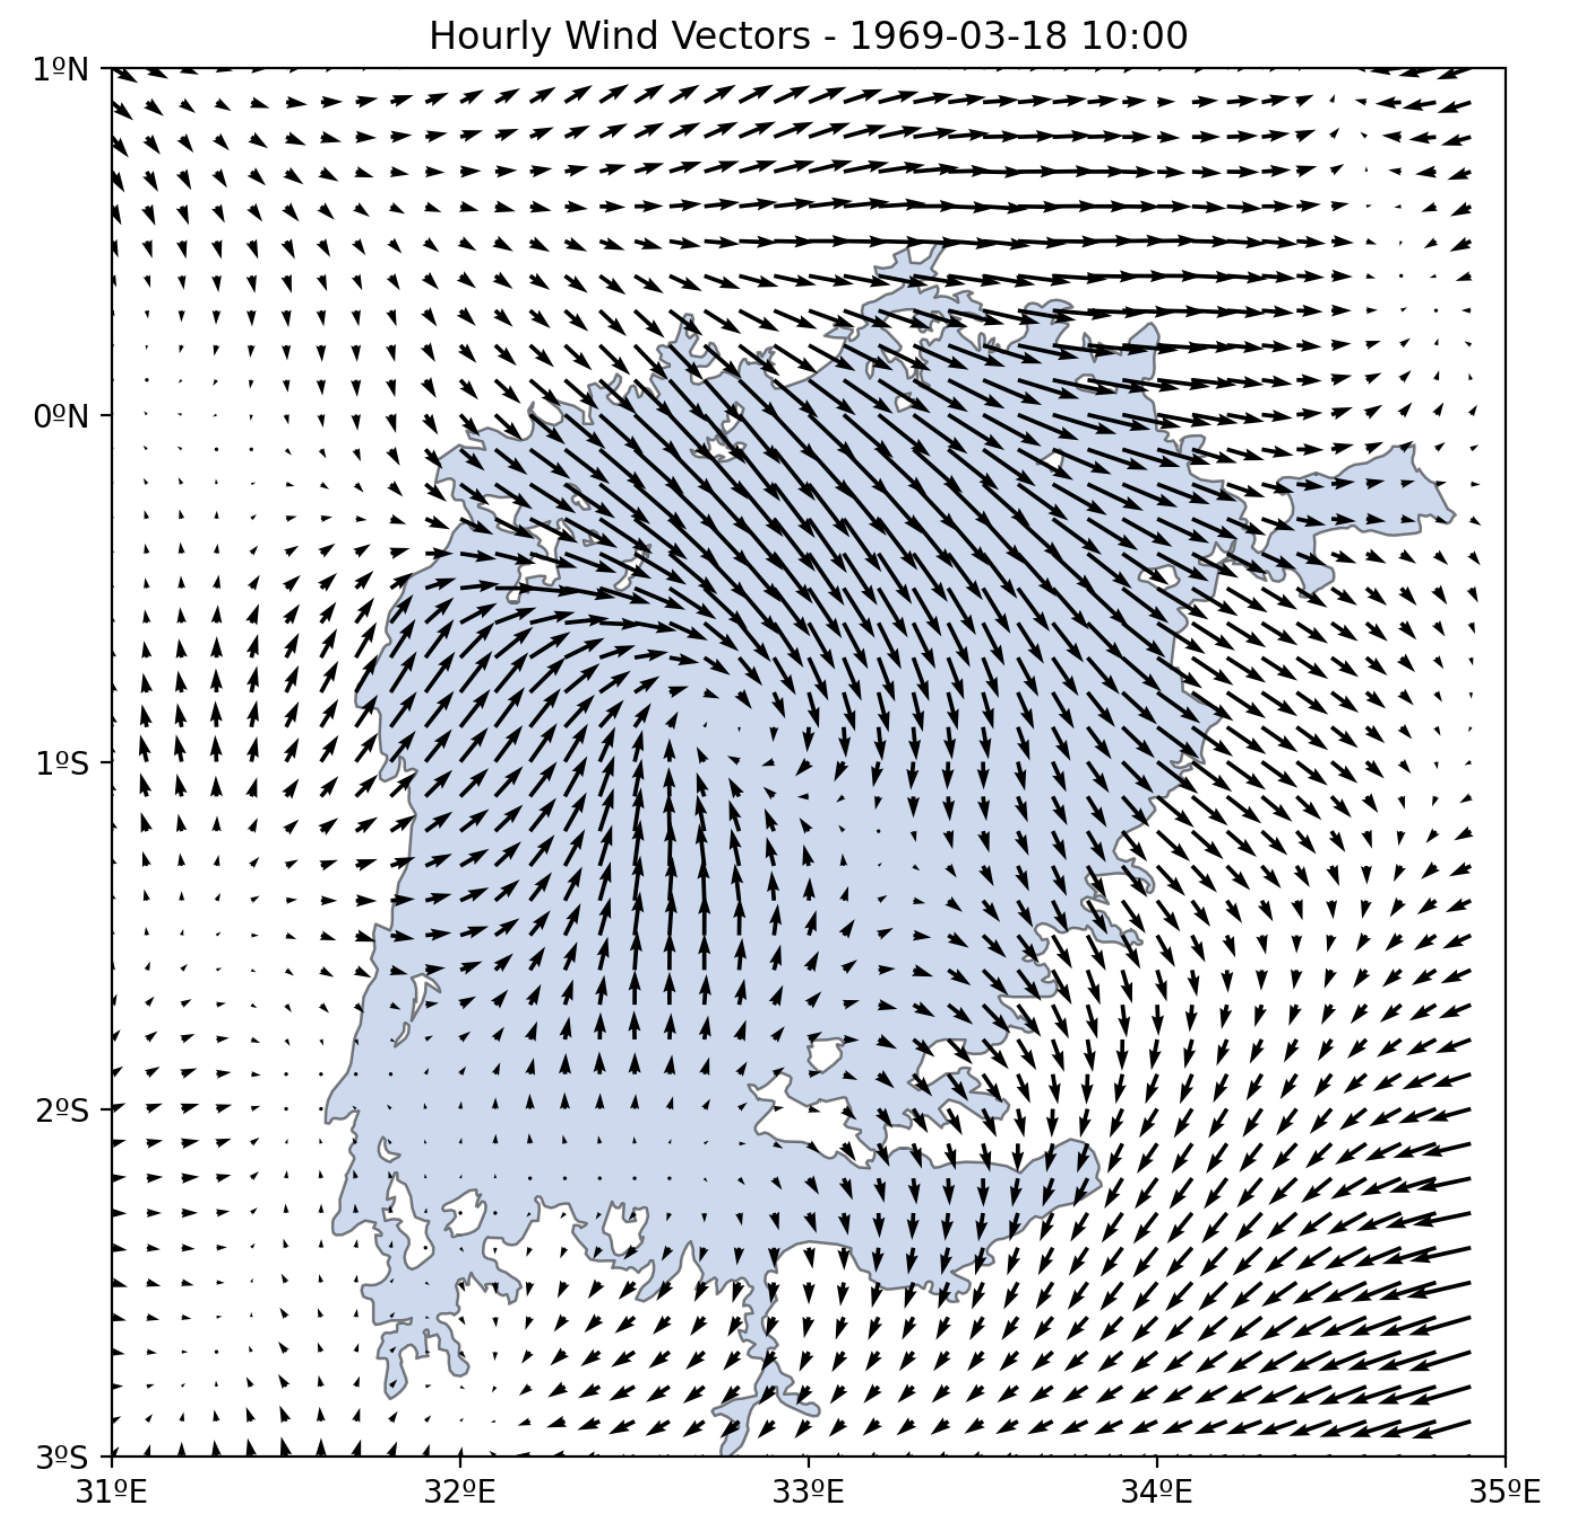
Example wind vector diagram from the March 1969 data
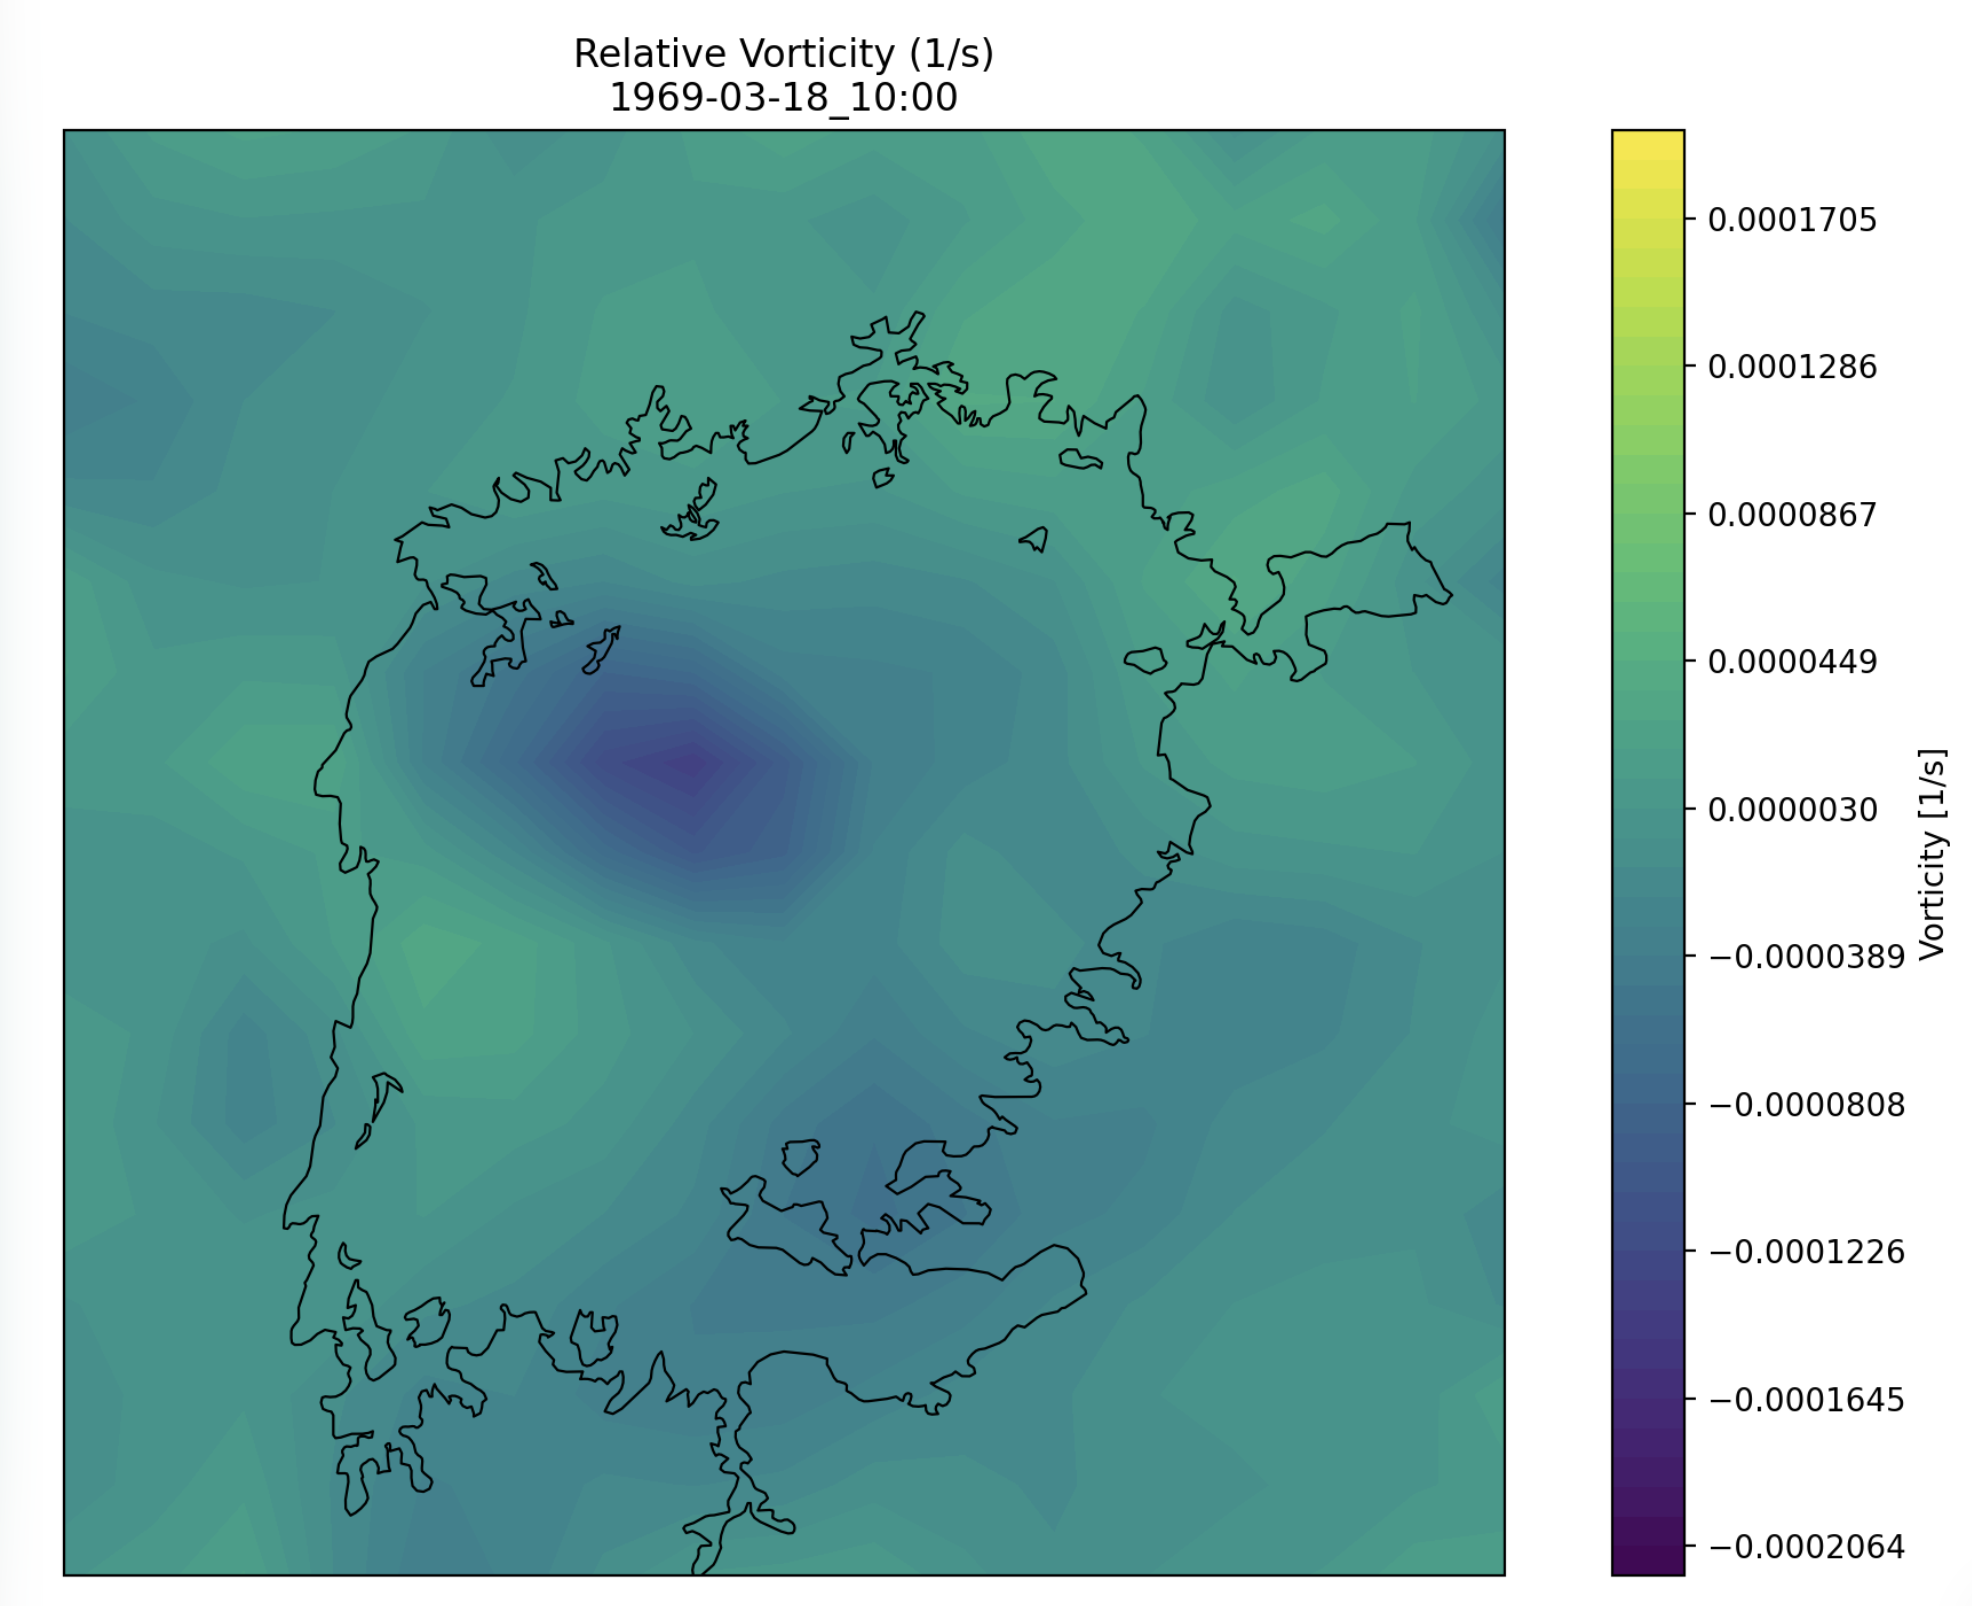
Example vorticity diagram from the March 1969 data