Visualization of NOx Concentrations
Principal Investigator(s)
Emmett Ientilucci
Research Team Members
Nina Raqueno
Project Description
Austin Powder manufactures, distributes, and applies industrial explosives for industries including quarrying, mining, construction, and other applications. Although it’s unusual, these massive explosions can release a foreboding yellowish-orange cloud that is often an indicator of nitrogen oxides—commonly abbreviated NOx. Austin Powder is seeking research into the ability to image these plumes so as to estimate concentration (using image processing, machine learning, sensors on drones) and estimate volume.
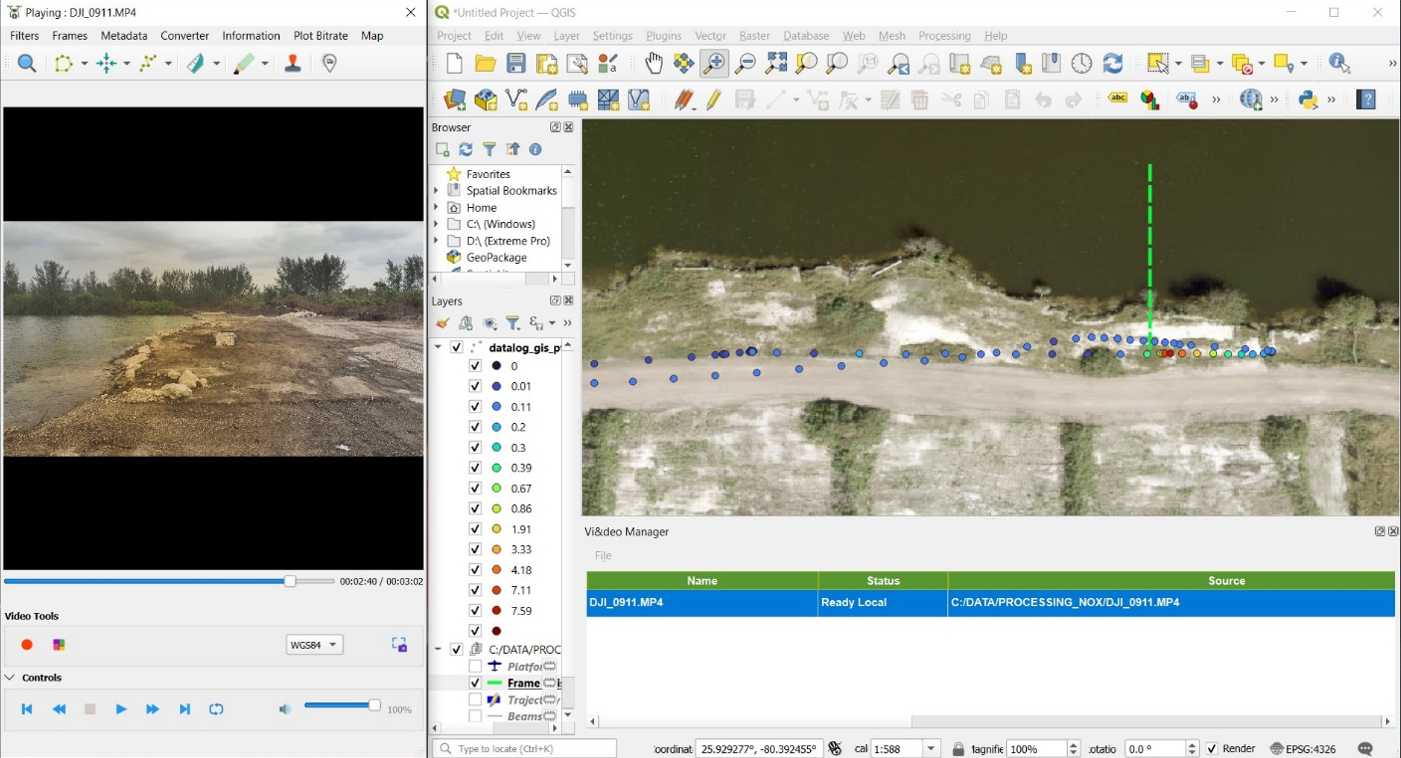
We have made field-deployable NOx ground sensors that mount to drones and are currently used by Austin Powder in the field. We have participated in Austin Powder customer blast data collections, created visualizations of NOx concentration and synced video data from UAS’s into a spatial environment (GIS) for spatial and temporal analysis. We have deployed our custom NOx sensors at customer sites to measure NO2 in units of ppm.
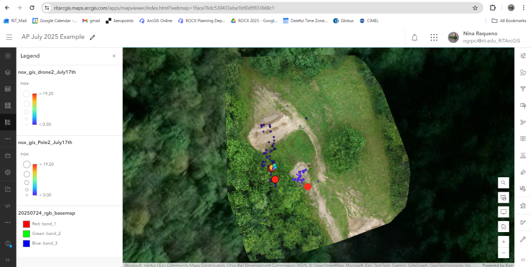
In this phase, RIT concentrated on creating an online system to upload, format, and visualize the NOx datalogger files. Although visualization of the NOx datalogger files has been demonstrated in past efforts, this phase produced an online workflow instead of relying on desktop GIS apps like ArcGIS Pro or QGIS. A customer simply uploads any of their collected NOx sensor data and coincident videos. Then a background script formats any new data into a GIS ready format which can be mapped using any public ArcGIS online account.
Figures and Images