Graph-Theoretic Moving Target Detector for Synthetic Aperture Radar (SAR) Imagery
Principal Investigator(s)
James Albano
Research Team Members
Grant Mason (MS Student)
Project Description
This work introduces a graph-theoretic algorithm for automatically detecting slow-moving, endo-clutter targets in SAR imagery by exploiting the distinctive color signatures these targets produce in colorized sub-aperture imagery (CSI). Detecting slow-moving targets is difficult when their Doppler shift falls within the clutter bandwidth, since the target signature must compete against bright clutter rather than the low power noise floor. Traditional single-channel approaches (sub-aperture analysis, shadow detection, sharpness metrics, time-frequency analysis, keystone formatting) each trade off resolution, computational cost, or robustness to heterogeneous clutter. CSI processing preserves most of the azimuth resolution while encoding a target's velocity and acceleration as a distinctive “curved rainbow” color artifact. This paper's contribution is the first automated method to detect that curved-rainbow signature, using image segmentation grounded in spectral graph theory rather than manual inspection.
The graph-theoretic ground moving target detector is outlined below:
- Thresholding and morphological processing: The CSI image is converted to HSV space, where a two-stage Otsu threshold separates bright, saturated (colored) pixels from the monochromatic background. Morphological opening then removes small speckle clusters leaving the moving-target signature and other larger clusters.
- Graph construction: The surviving pixels become graph vertices. A k-nearest-neighbor (kNN) graph connects each vertex to its nearest neighbors in HSV space, with edge weights based on spatial proximity. A minimum spanning tree is included to guarantee full connectivity.
- Recursive graph bisection: Using the Fiedler eigenvector of the graph Laplacian, the graph is recursively split into subgraphs (clusters) based on algebraic connectivity, until further splitting no longer meaningfully increases connectivity.
- Moving target detection metrics: Each subgraph is scored on four metrics — percentage of hues present, percentage of nodes sharing the dominant hue, color-gradient slope, and Pearson correlation coefficient — to identify which cluster best matches the expected rainbow signature.
Figure 1 applies the detector to a real Capella Space spotlight image collected near İskenderun, Turkey (21 Oct 2022, 0.32 m range / 0.05 m azimuth resolution) and shows the algorithm's output: sixteen candidate clusters were evaluated, and the algorithm correctly isolated the suspected moving target (cluster 13, yellow box) while rejecting all other clusters (red boxes) as clutter or noise.
Figure 2 presents a more challenging case: an Umbra Space spotlight image over an airport in Thailand (2 Jan. 2024, 0.5 m range / 0.25 m azimuth resolution) with lower signal-to-clutter ratio and heterogeneous background clutter. Using the same detection thresholds, the algorithm identified four candidate moving-target ROIs (yellow boxes) among many rejected clusters (red boxes). The authors note that two of the accepted detections (clusters 6 and 7) only partially exhibited the expected color spectrum due to competing clutter or lower brightness, illustrating the value of using multiple, less restrictive metrics rather than a single strict criterion when selecting subgraphs.
Across both real-data scenes, the graph-based detector successfully extracted signatures characteristic of moving targets, though the authors note detections could not be independently confirmed without ground truth. A data collection with ground truthed moving targets is being planned.
Figures and Images
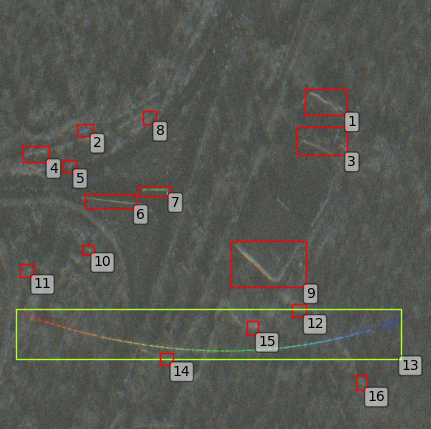
The algorithm separates the colorful pixels from monochromatic clutter and detects the suspected moving target, cluster 13, in the green bounding box while rejecting all others.
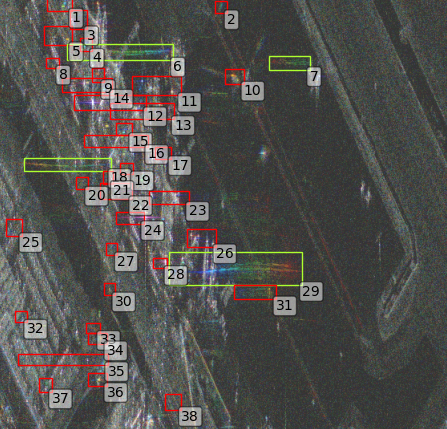
Four potential moving target ROIs are identified. Note numbers 6 and 7 are identified while missing some of the spectrum of expected color due competing clutter or lower brightness. This demonstrates the utility of multiple less restrictive metrics when selecting subgraphs.