Modeling the impact of future Landsat spectral capabilities for monitoring water quality and harmful algal blooms
Principal Investigator(s)
Anthony Vodacek
Research Team Members
Nina Raqueño, Ryan Ford
Project Description
This project focuses on using spectral imagery to retrieve concentrations of waterbody components using modeled Look-Up-Tables (LUTs) to determine how imaging systems could be improved for this task, e.g., Landsat. This work extends the LUT retrieval method to assess its ability to retrieve pigments related to harmful cyanobacteria blooms. Imagery from Landsat satellites, as well as multi and hyperspectral unmanned aerial system (UAS) is used for this assessment.
Project Status:
In the past year we have determined the factors of the LUT retrieval pro- cess that affect retrieval error, the largest being atmospheric compensation, sensor noise, and the inputs/design of the LUT, which gives us direction for future work. Some of our improved mapping results are shown below for Owasco Lake. However, the spectral response of a sensor remains critical for water applications and our results demonstrate the value of an imaging spectrometer whether that sensor is on a satellite or a UAS.
Our modeling approach was used to test various future Landsat spectral configurations (below) and demonstrated clear improvements when the spectrum is more finely sampled. Ryan Ford will defend his dissertation in summer 2019.
Figures and Images
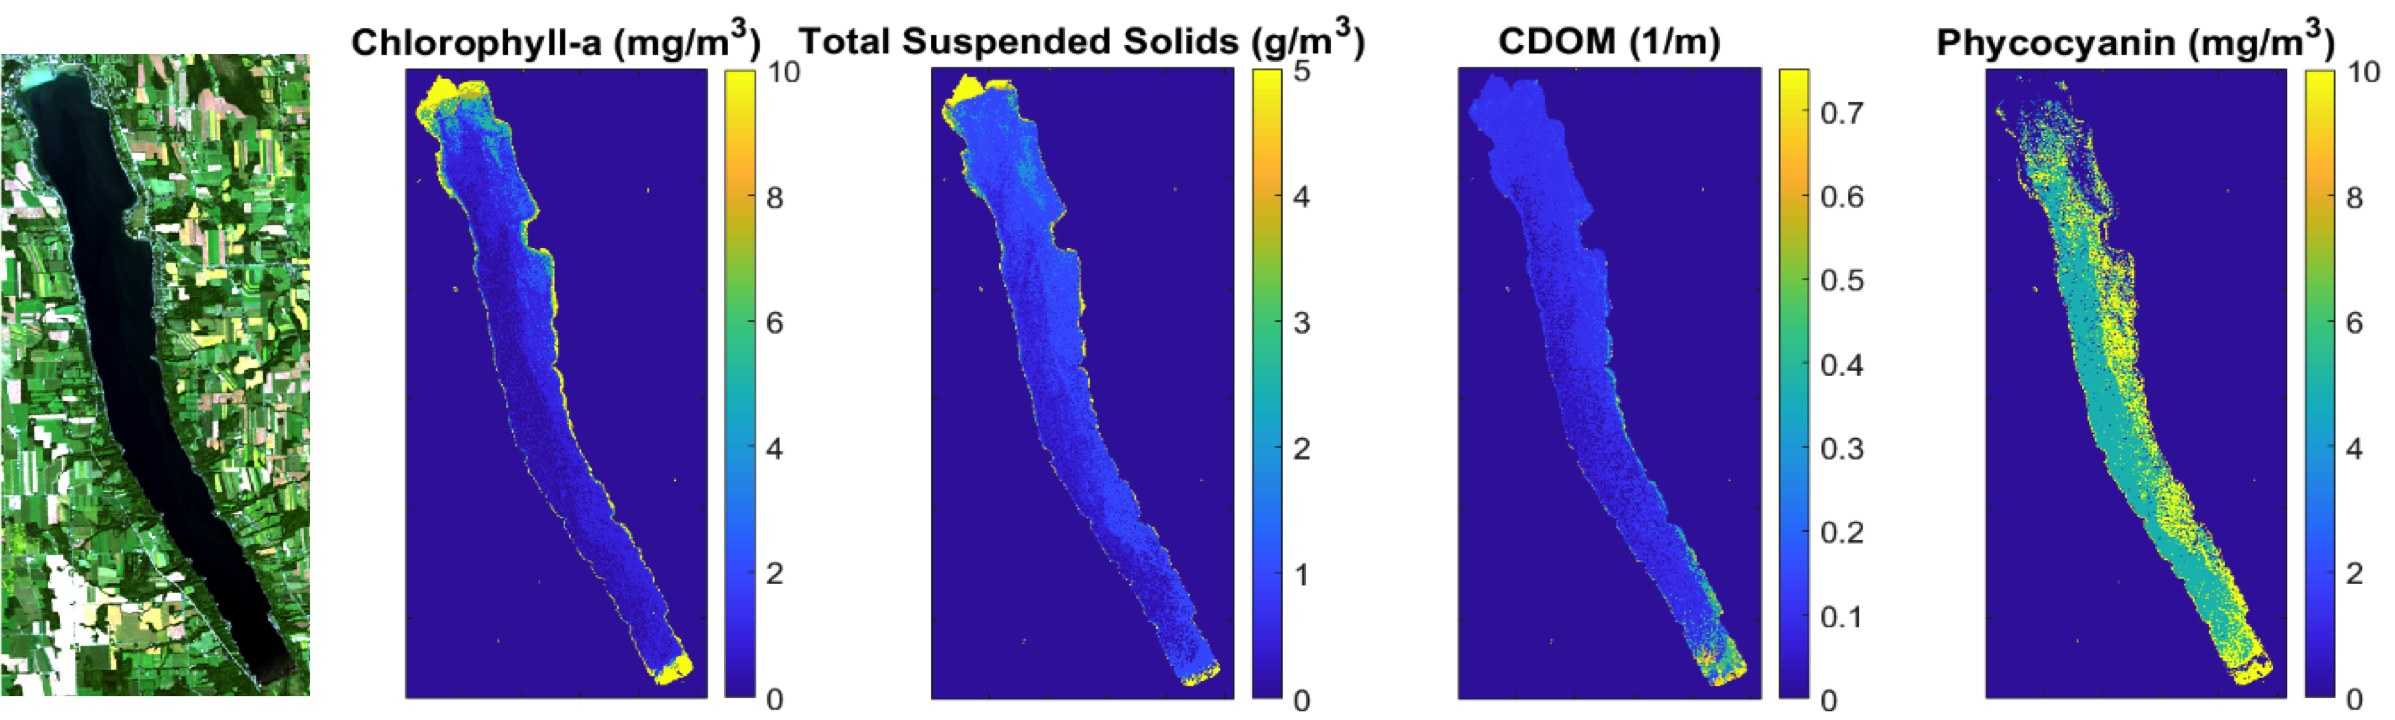
Water component concentrations retrieved from Landsat 8 imagery of Owasco Lake, NY, USA on September 20, 2016. Left to right: true color, chlorophyll-a concentration, total suspended solids concentration, colored dissolved organic matter absorption coefficient, and phycocyanin concentration (pigment of cyanobacteria responsible for harmful algal blooms).
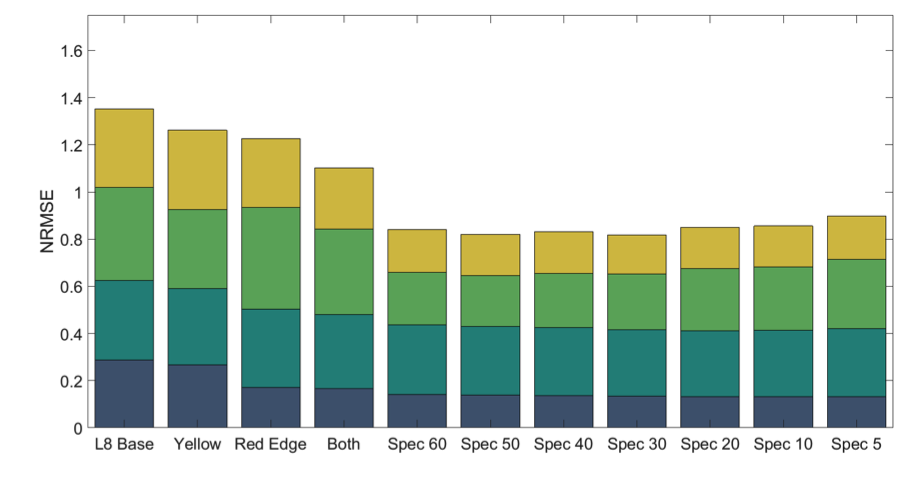
Comparison of all possible spectral configurations tested versus the baseline system (L8 Base). Normalized Root Mean Squared Error is the y-axis. Systems that only added a yellow band, a red edge band, or both, are represented by the mean error for each component over all locations and bandwidths. The imaging spectrometer data (Spec 60 to Spec 5) are for band spacing from 60 nm down to 5 nm and are for the band center locations providing the lowest error. All systems assume noise characteristics similar to Landsat 8.