Systems for monitoring biodiversity in the Madagascar rainforest
Principal Investigator(s)
Anthony Vodacek
Research Team Members
Timothy Bauch, Morgan Webb, Paul Vandame
Project Description
In a joint project between RIT and the Seneca Park Zoo, several remote sensing modalities were exploited to assess the biodiversity of the Madagascar rainforest. With the ultimate goal of creating an immersive digital environment that would allow Zoo patrons to experience a Madagascar rainforest, data collections for the physical and sound structure of the rainforest as well as 3D images of some of the many small animals of the rainforest were planned for Ranomafana National Park at the Centre ValBio.
Project Status:
In January/February 2019 Professor Vodacek and Tom Snyder of the Seneca Park Zoo visited Centre ValBio with a number of goals. These included scouting areas outside the park for reforestation and testing a drone for monitoring tree growth, testing the 3D multi-camera system for imaging small animals of the park, and collecting audio and ground-based lidar data of a rainforest study site in the park. The 3D imaging equipment was built by Tim Bauch using 16 Raspberry Pi cameras arranged on a hemisphere. The camera control software was written by RIT freshman Morgan Webb. The ground-based lidar system of Prof. van Aardt was borrowed for physical scans of the forest. Lastly, an array of open-source AudioMoth microphones was deployed to obtain the loud and diverse sounds of the forest. The 3D multi-camera system set-up in the Centre ValBio laboratory is shown above. A single example of an image of a small chameleon collected by the multi-camera system is provided. Spectrograms of audio data from the rainforest site are shown for sunrise and sunset (bottom of next page). We are still in the process of analyzing data from all of these sources with the help of a visiting PhD student from France in summer 2019. Paul Vandame is a PhD student working with Dr. Jocelyn Chanussot at Grenoble INP ENSE3. Vandame’s primary effort during his visit is an in-depth analysis of the audio data using machine learning approaches to isolate the different sounds recorded in the rainforest.
Figures and Images
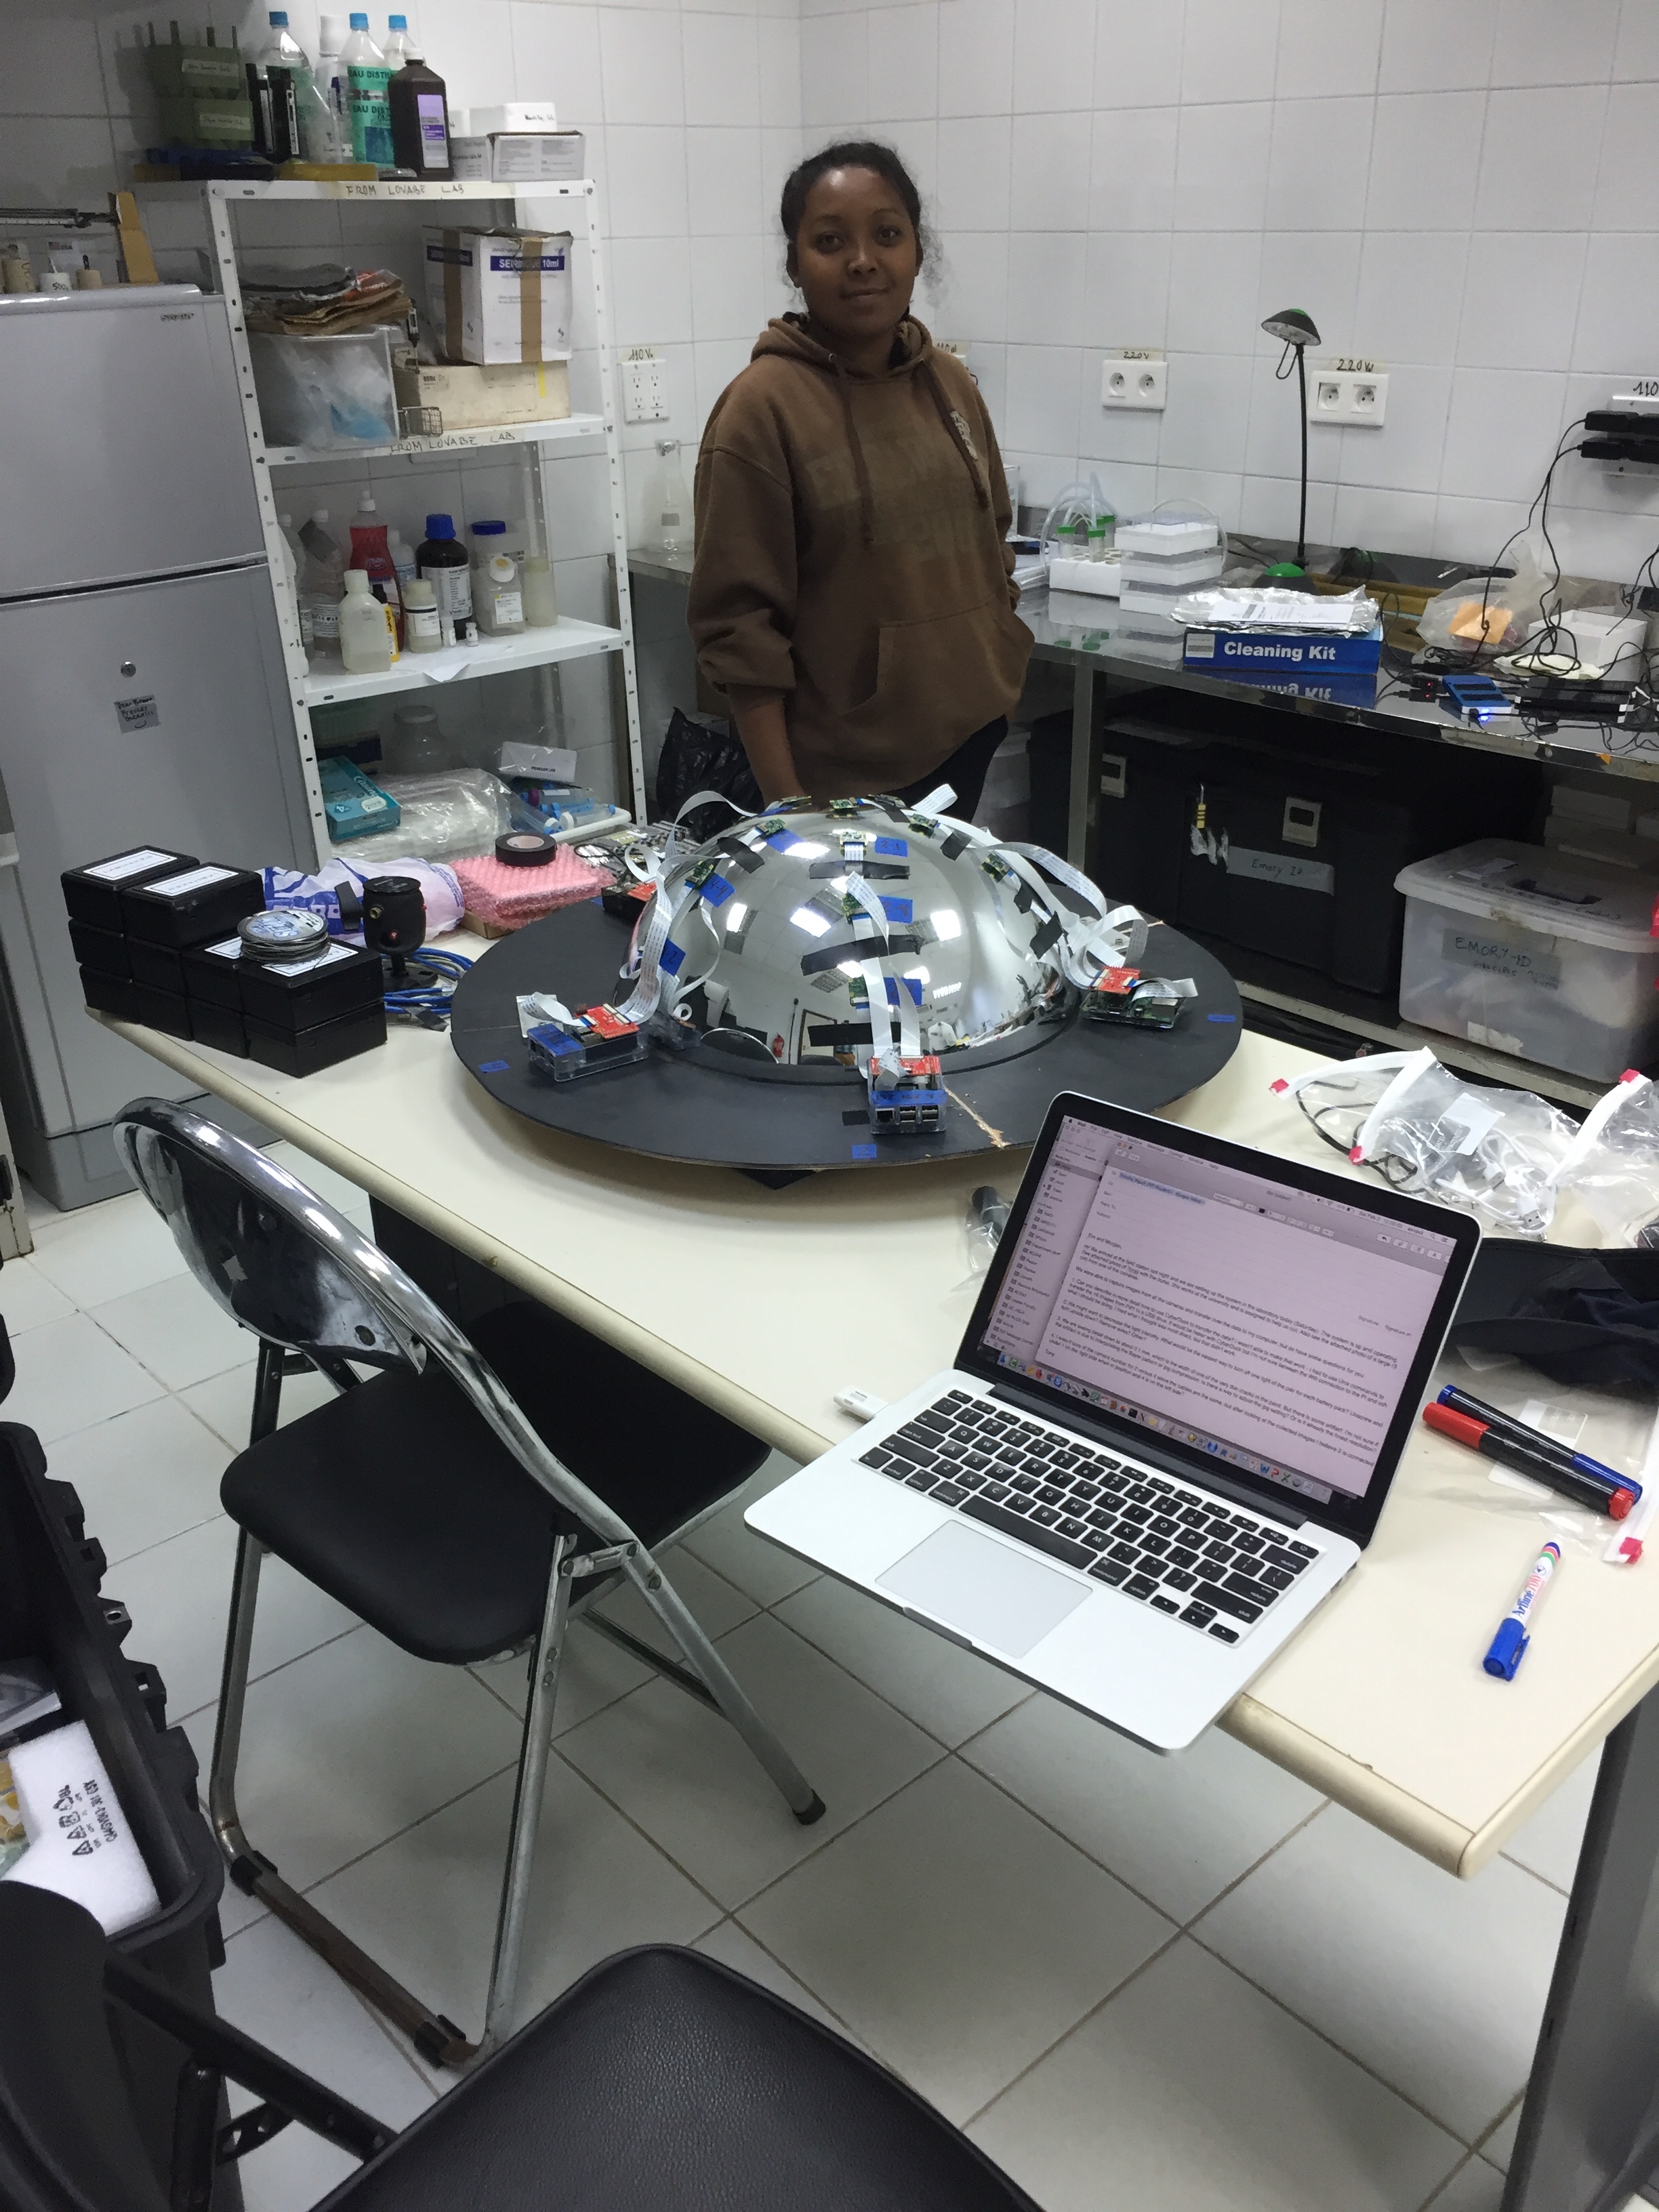
Annick Andriatiavina, a scientist from the University of Antananarivo with the hemispherical dome of the 3D multi-camera system on the table.
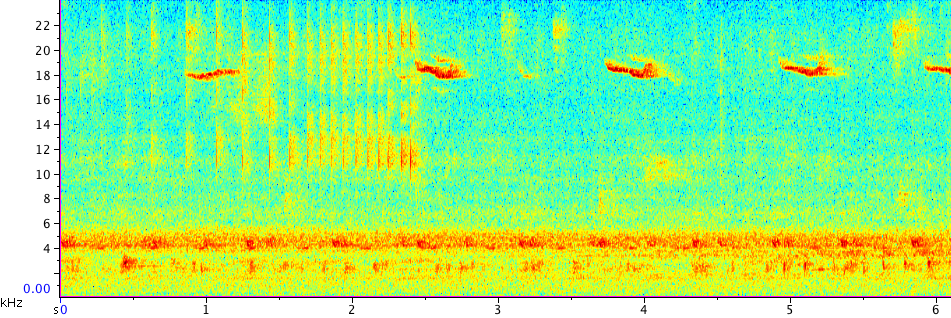
(a) A six second selection (x-axis) of the audio spectrogram of the Ranomafana rainforest at sunrise. Audio frequency is on the y-axis and color indicates amplitude (blue is quiet and red is loud). A rich set of time/frequency/amplitude patterns illustrates the diversity of biota, mostly insects and frogs in this case. Frequencies above about 12 khz are from insects and are too high for human hearing in this environmental setting. (b). A six second selection of the audio spectrogram of the same forest at sunset illustrating a very different set of time/frequency/amplitude patterns. The strong signals at 18 khz repeated about every 1.5 seconds are the high frequency echo-location chirps of a bat.