Dashboards
- RIT/
- Enterprise Data & Analytics/
- Dashboards
Explore Institutional Data
This page provides access to official institutional data used to support planning, decision-making, accreditation, assessment, program review, and strategic initiatives across the university. These reports bring together trusted information on enrollment, student success, academic programs, faculty, instructional activity, student experiences, and other key university metrics.
Enterprise Dashboards
RIT Account Required
|
|
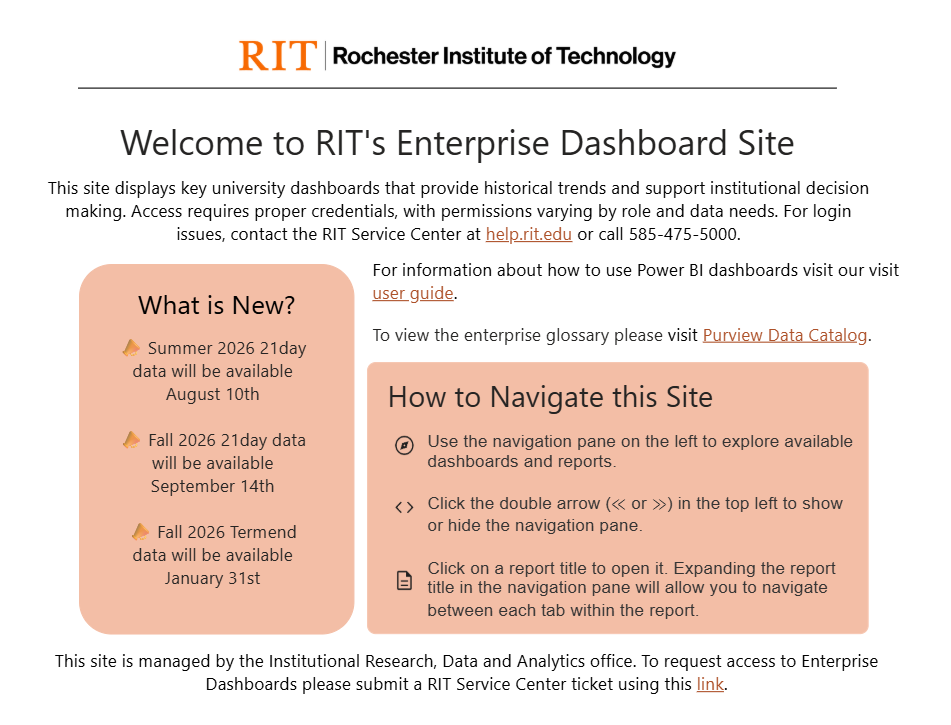
Authorized RIT users can access official institutional data using the Enterprise Dashboards App. Users can explore trends, apply filters, drill into details, and personalize their view of institutional data through a secure, web-based experience, built on Power BI. Dashboard availability may vary based on your role and approved access level. Available at enterprisedashboards.rit.edu! |
For assistance with access requests, authentication issues, or dashboard questions, contact the RIT Service Center.
Publicly Available Information
Institutional Data List by Area
| Dashboard | Description | Access |
|---|---|---|
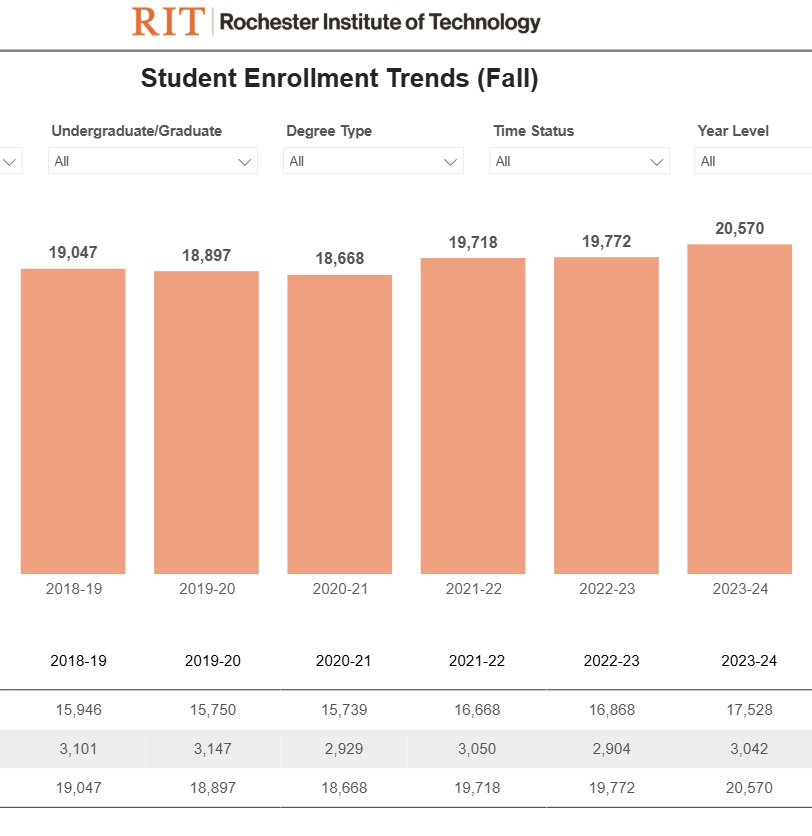
| Enrollment Trends |
Interactive dashboards of student enrollment data. Includes enrollment counts by program, country and state. |
Public |
| 21-Day Enrollment |
21-Day enrollment statistics, including breakdowns by college and academic major. |
Special Permissions Needed |
| Executive Registration |
Weekly registration counts through 21-Day. |
Special Permissions Needed |
| Global Enrollment |
Student enrollment in RIT global locations |
Special Permissions Needed |
| Dashboard | Description | Access |
|---|---|---|
| Freshman Persistence & Graduation |
Full-Time, first-time freshman persistence and graduation rates. |
Special Permissions Needed |
| Graduate Student Retention |
Graduate student persistence and graduation rates. |
Special Permissions Needed |
| Executive Preliminary Persistence & Graduation |
Preliminary persistence and graduation rates. |
Special Permissions Needed |
| Retention Insights Factors | Profile comparison of students who retained to those who left. | Special Permissions Needed |
| Dashboard | Description | Access |
|---|---|---|
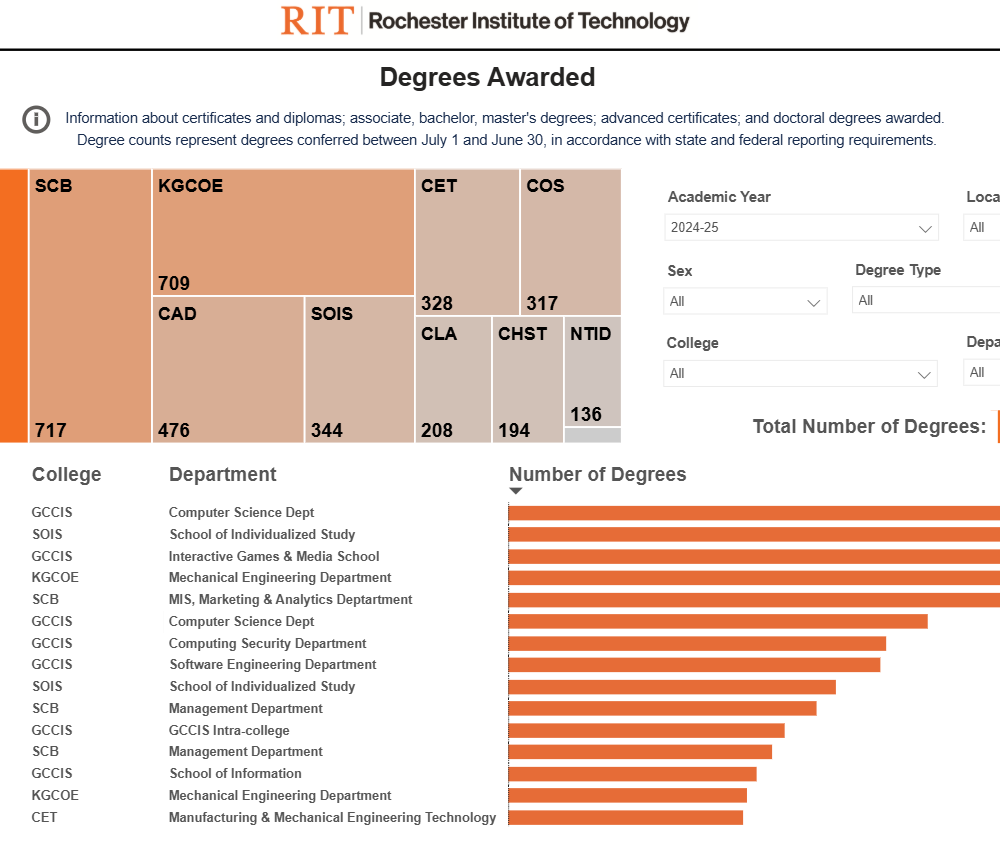
| Degrees Awarded |
Information about certificates and diplomas; associate, bachelor, master's degrees; advanced certificates; and doctoral degrees awarded. |
Public |
| Dashboard | Description | Access |
|---|---|---|
| Academic Program Assessment (Undergraduate) |
Metrics for Tier I Undergraduate Academic Program Review. |
Special Permissions Needed |
| Academic Program Assessment (Graduate) |
Metrics for Tier I Graduate Academic Program Review. |
Special Permissions Needed |
| Program Analytics |
Student enrollment, persistence and graduation rates for undergraduate and graduate academic programs. |
Special Permissions Needed |
| Dashboard | Description | Access |
|---|---|---|
| Academic Alerts by Student |
List of students with Starfish academic alerts. |
Special Permissions Needed |
| Dashboard | Description | Access |
|---|---|---|
| Section Size |
Class size statistics, including breakdowns by level, college, and academic department |
Special Permissions Needed |
| DFW Rates & Grade Distribution |
Distribution of grades and D, F, and W (withdrawal) rates |
Special Permissions Needed |
| Dashboard | Description | Access |
|---|---|---|
| Credit Hours |
Detailed credit hour reports showing both generated and consumed hours across the University and at each college. |
Special Permissions Needed |
| Dashboard | Description | Access |
|---|---|---|
| Ruffalo Noel Levitz |
Aggregated results from the Ruffalo Noel Levitz (RNL) student satisfaction survey. |
Special Permissions Needed |
| NSSE |
Aggregated results from the National Survey of Student Engagement (NSSE) survey. |
Special Permissions Needed |
| Dashboard | Description | Access |
|---|---|---|
| Instructional Activity Reports |
Reports instructional activity per section count and credit hour data over four years. Reported at the university and college levels. To access the Instructional Activity Report Definitions, click here. |
Internal - RIT Account Required |
| Dashboard | Description | Access |
|---|---|---|
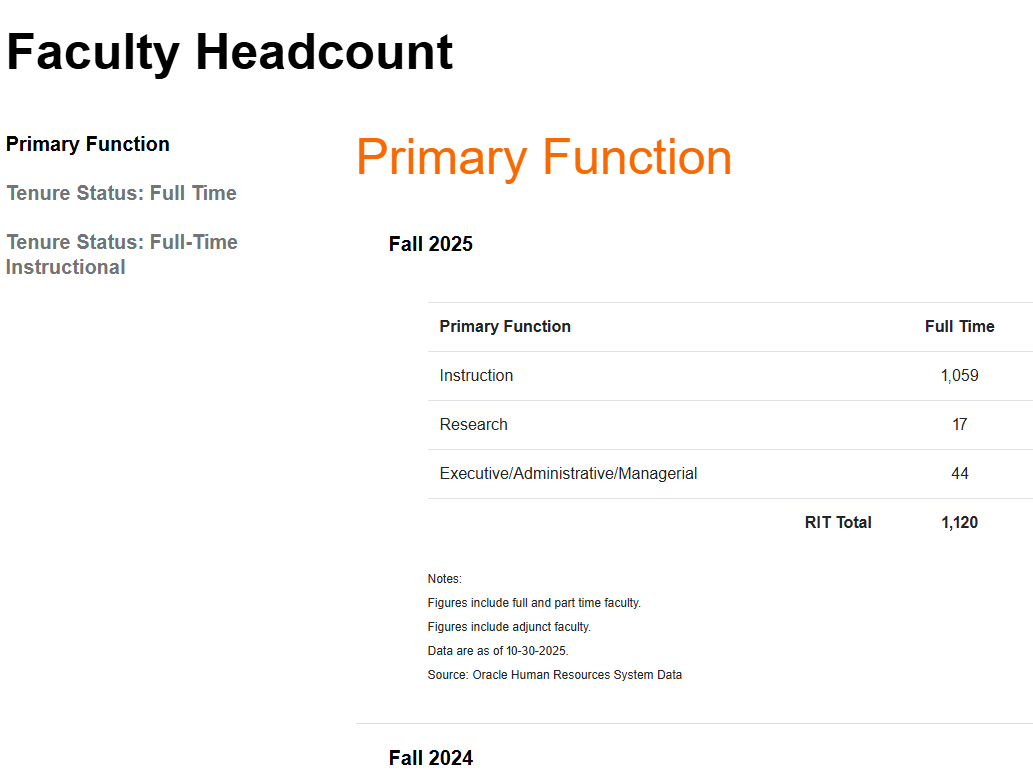
| Faculty Headcount |
Faculty Headcount summarizes faculty counts by tenure status and instructional role across recent fall terms. |
Public |
| Dashboard | Description | Access |
|---|---|---|
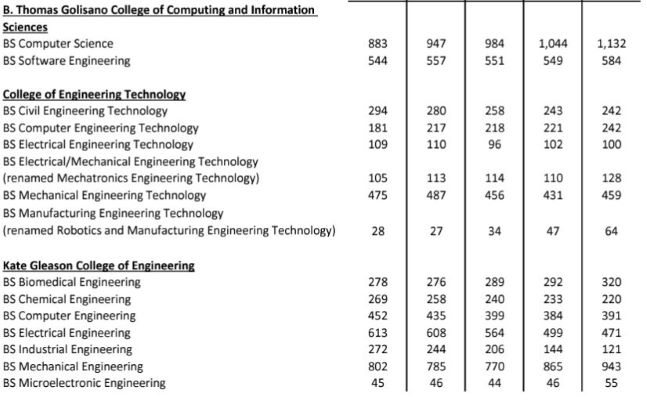
| ABET Accreditation |
Student enrollment and graduation data for RIT’s ABET-accredited programs. |
Public |
| AACSB Accreditation |
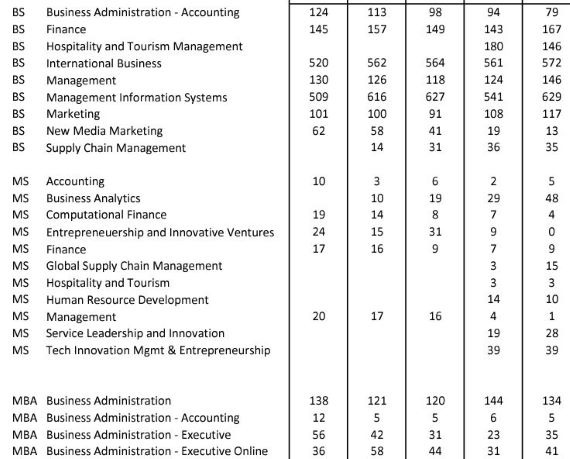
Student enrollment, retention and graduation data for AACSB-accredited programs. |
Public |
Help & Additional Resources
If you are having trouble logging into a dashboard, please visit the RIT Service Center (RSC) at help.rit.edu or call 585-475-5000.
Click here to view the Enterprise Data Warehouse (EDW) Production Load Schedule.
For information about how to use Power BI dashboards please visit our user guide.
To view the enterprise glossary please visit Purview Data Catalog.